Flight Deck in Focus: Minimizing Fuel Burn while Optimizing Flight Time
In this edition of ‘Flight Deck in Focus’, we take a closer look at Cost Index Optimization in Jeppesen FliteDeck Pro, and how it replaces a single fixed, fleet-wide number with a tail-specific recommendation built from each aircraft’s own performance data.
Every flight starts with a number almost nobody questions. Cost index arrives on the flight plan, gets typed into the FMC during the pre-departure flow, and stays there until the aircraft is on blocks. In most operations that number is fixed and applies across an entire fleet. An enormous opportunity left on the table.
Calculating CI is a badly underestimated challenge. It sounds simple: the ratio between the cost of time and the cost of fuel. But each side hides real work: separating the operating costs that truly move with time from those that are fixed, and pinning down the actual price of the fuel already in the tanks, uplifted across different airports at different prices along the way.
That almost impossible task pushes many operators toward a single value, usually aimed at maximum fuel savings, sometimes set a little higher to sit closer to a Long Range Cruise (LRC) regime, chosen largely by feel. And the most important part: the results rarely arrive as expected.
Why Cost Index matters now
The room for treating CI as a set-and-forget value has closed. IATA forecasts an average jet fuel price of USD 152 per barrel in 2026 — close to 70 percent above the previous year — pushing the industry fuel bill to roughly USD 350 billion and lifting fuel’s share of operating expenses from 25.4 percent to 31.4 percent in a single year. Over the same period, industry net profit is expected to fall from USD 45 billion to USD 23 billion, with net margins compressing to 2.0 percent.
When fuel accounts for nearly a third of operating cost and the margin on top of it is two cents on the dollar, the speed an aircraft flies stops being a technical detail and becomes a financial one.
What cost index actually controls
As mentioned, cost index is the ratio between time-related operating costs and the cost of fuel. It tells the Flight Management Computer how to trade one against the other, and the FMC converts that instruction into ECON speeds for climb, cruise and descent. A low CI favors fuel savings. A high CI favors higher speed. Zero commands the speed for minimum-fuel burn on that flight, or so we think.
The mechanics are sound. The inputs are the problem.
Start with the number itself. For most operators the CI is a fixed, fleet-wide figure. At best it gets recalculated when fuel prices move. The specific tail, its weight today, the temperature at altitude: none of it enters the number, and the crew flies it with no real-time reference to tell them whether it is right.
Even when calculated, the performance model behind those ECON speeds was built during certification flight testing — a factory-fresh airframe, stabilized speeds, controlled conditions, results normalized to standard atmosphere. Every aircraft then starts drifting away from it as soon as it leaves the factory. Engines deteriorate. Surfaces accumulate drag from repairs, an added connectivity antenna and operational wear. Each tail develops its own performance signature, and none of that is visible to the FMC.
The result is an aircraft computing exactly the right speed for an airframe that no longer exists.
The workflow on an intelligent flight deck
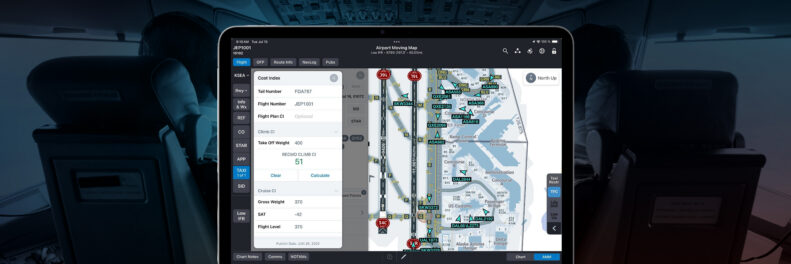
Cost Index Optimization, directly integrated into Jeppesen FliteDeck Pro, closes that gap inside the EFB the crew is already using.
It starts with the operator’s own data. Historical operational flight data are used to build performance curves for each individual aircraft, so the reference is not a certified baseline but observed behavior: how that specific tail flies today.
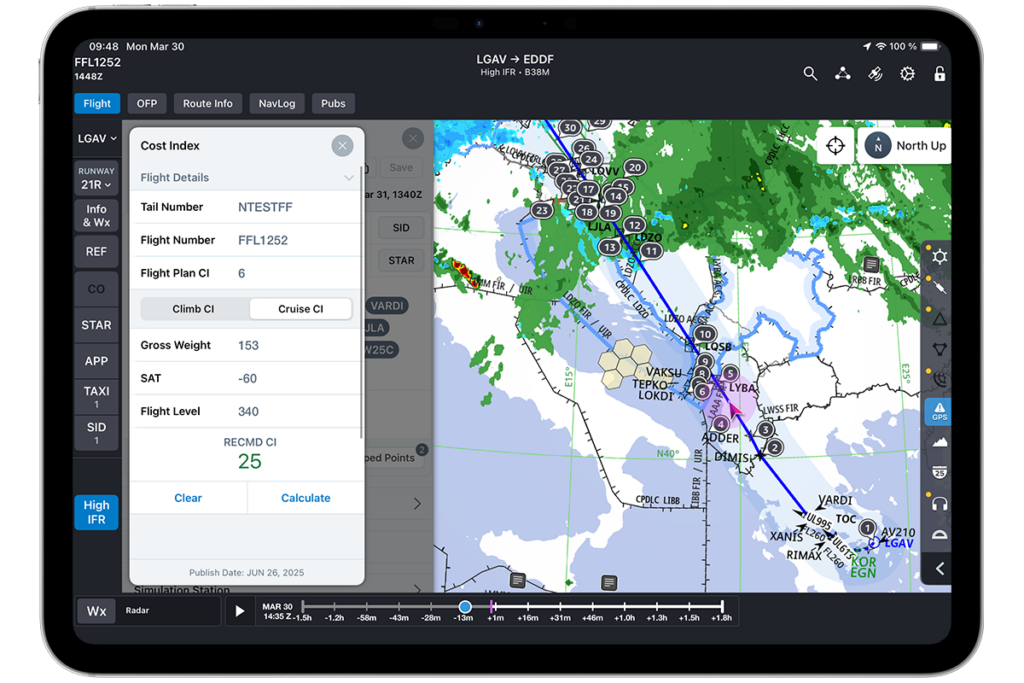
In the cockpit, the interaction is deliberately small. The crew enters three values — weight, temperature and flight level — and Cost Index Optimization on FliteDeck Pro returns the cost index that puts that aircraft, in those conditions, at its true efficiency point: its real Maximum Range Cruise (MRC) speed. On aircraft with a supported Aircraft Interface Device, those three inputs populate automatically and the recommendation is calculated without any crew entry at all.
Cost Index Optimization integrated with Jeppesen FliteDeck Pro.
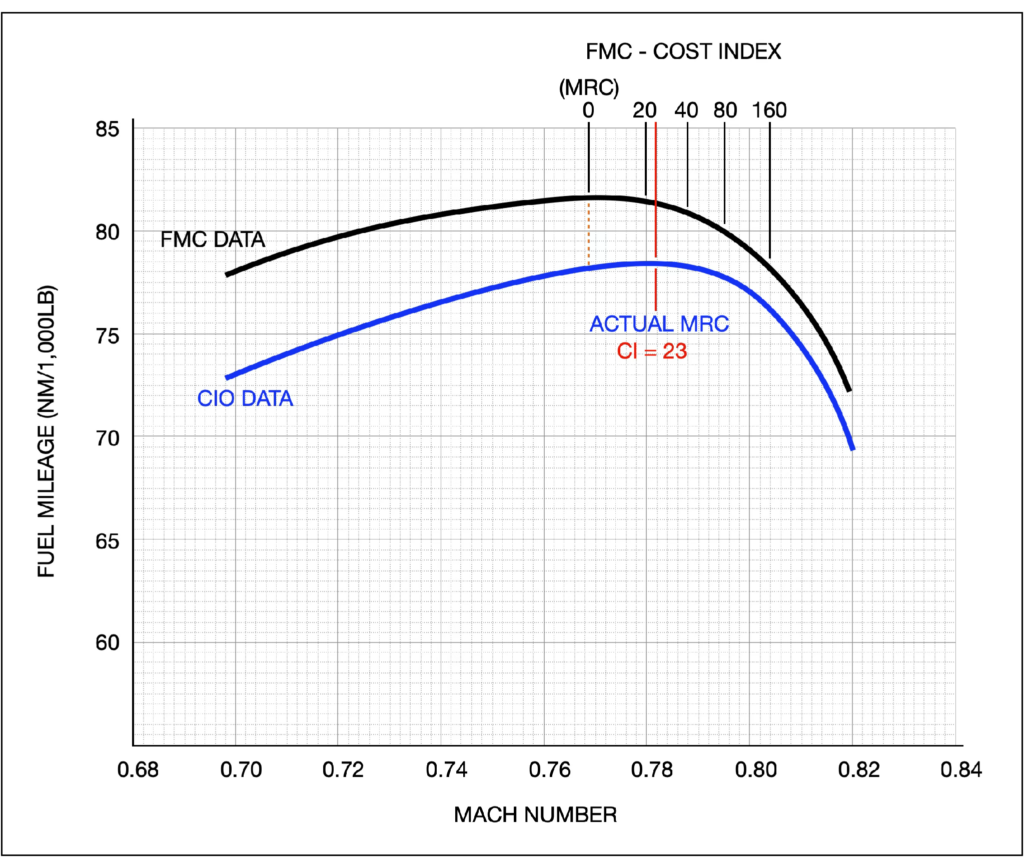
The result is frequently counter-intuitive: because real fuel-mileage curves often peak slightly faster than the book suggests, the CI for MRC is often higher than zero. The aircraft burns less fuel and arrives earlier, a result the FMC has no way of finding on its own.
Fuel Mileage data analysis comparing FMC and CIO, on a Boeing 737-800 weighing 150,000lb at FL350.
Climb gets its own number
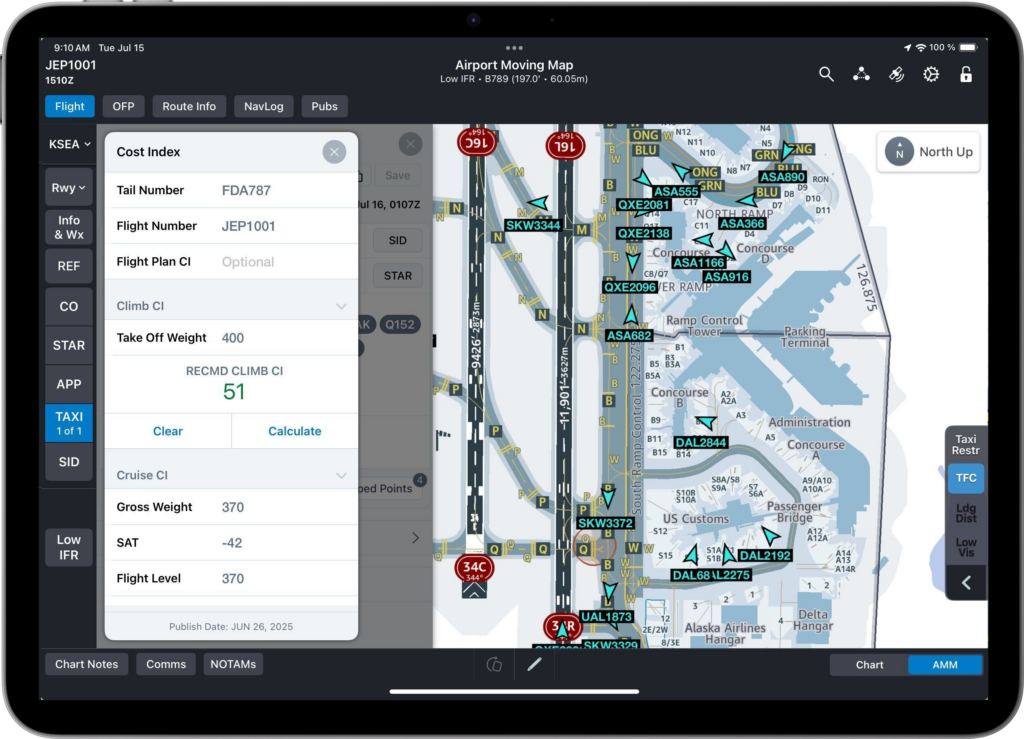
For version 5.2 and on, FliteDeck Pro presents Climb CI and Cruise CI as two separate advisories on distinct tabs, on supported aircraft types.
There is a good operational reason for the split. The ECON climb speed schedule is generated once, early, as a function of cost index and initial climb weight, with corrections applied for forecast wind and temperature at top of climb. It is then flown all the way up, covering the segment with the highest fuel flow of the entire flight.
Climb also loads the aircraft differently than cruise does: thrust-limited, at high weight, and through continuously changing air density. The tail-specific correction that makes a cruise speed right is not the same correction that makes a climb schedule right. Treating them as one number leaves part of the profile unoptimized. Splitting them keeps the crew’s workload at two quick entries while covering both.
CIO calculated for climb.
What this looks like across an operation
Operators running Cost Index Optimization typically see a 1 to 2 percent reduction in fuel burn. One UK-based carrier recorded a 1.7 percent reduction in in-cruise fuel consumption, equivalent to roughly 1,900kg of CO2 avoided per flight.
Just as importantly, none of it depends on new hardware, a second EFB application, or any change to FMC software or certification databases. The advisory appears in the workflow crews already run, right within FliteDeck Pro. Theoretical savings that were expected but never seen are now starting to show up in real-world data.
With tail-specific guidance for both climb and cruise, cost index now becomes what it was always supposed to be: an active lever, applied to the aircraft actually being flown.
Cost index is the ratio of an aircraft’s time-related operating costs to its fuel cost. The FMC uses it to calculate ECON speeds for climb, cruise and descent. A low value prioritizes fuel efficiency, a high value prioritizes higher speeds, and zero commands the minimum-fuel speed.
Why isn’t a fleet-wide cost index good enough?
Because a fleet-wide value assumes every airframe performs like the certification model. Engine deterioration and accumulated drag mean each aircraft has its own efficiency point, so a single number is slightly wrong for nearly every tail in the fleet.
What is a tail-specific cost index?
It is a cost index calculated from the actual recorded performance of one individual aircraft, using the operator’s own QAR or FDR data, rather than from manufacturer flight-test baselines.
Does optimizing cost index always mean flying slower?
No. Because real fuel-mileage curves frequently peak at a higher speed than published data indicates, an optimized cost index is often higher than the planned value — reducing fuel burn and trip time at the same time.
Why does climb need a separate cost index from cruise?
The ECON climb speed schedule is set early in the flight and flown throughout the climb, a phase with the highest fuel flow, high weight and thrust-limited performance. Optimizing it separately from cruise addresses a part of the profile a single cruise-oriented value cannot reach.
What does an airline need to get started?
FliteDeck Pro 5.0 or later, and historical flight data for the fleet. Jeppesen builds the tail-specific performance curves, activates the capability on subscribed aircraft, and tracks fuel usage before and after activation so savings can be measured.
What is cost index optimization?
Cost index optimization is the practice of replacing a fixed, fleet-wide cost index with a tail-specific value drawn from each aircraft’s own recorded performance and its actual weight, temperature and flight level. It targets the real Maximum Range Cruise (MRC) speed of the specific airframe rather than a certified average. This article covers the fundamentals in full.