FUEL DASHBOARD – SAVINGS CALCULATION METHODOLOGY
No two airlines are the same and rarely will airlines approach a problem exactly the same way.
When calculating and reporting on fuel savings, airlines conducting initiatives that do not rely exclusively on actual data calculations (like taxi out fuel, climb fuel or cruise altitude) will often have different views on how to determine their savings. Recognizing that there is no one-size-fits-all formula for this, Fuel Dashboard’s custom analytics module – Dashboard Editor – enables airlines to create their own savings calculation methodology and build tailored dashboards that display actual achieved savings in a way that makes sense for their operations.
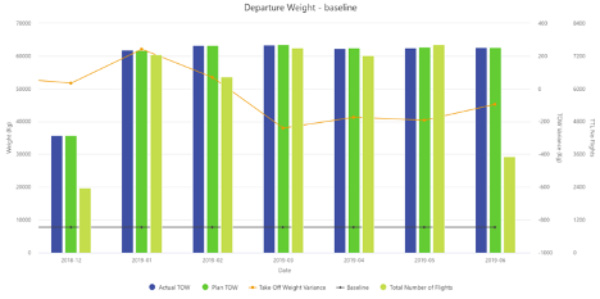
As an example, let’s look at a custom dashboard the Fuel Dashboard team built to calculate departure weight savings. Using the QAR and flight plan data, the team looked at Planned Take-Off Weight and Actual Take-Off Weight to derive a variance. From that, we created a baseline and used it to calculate the savings variance.
The Take-Off Weight Variance falling above the baseline indicates that savings have been achieved – parameters like flight duration, weight factor, and total number of flights can then be used to derive actual savings.
Dashboard Editor equips airlines with the ability to create a custom analysis like this using the 650+ parameters available within the Fuel Dashboard solution. Users can apply diverse data triggers, filters, and a range of visualization techniques to customize reports and dashboards for more accurate, efficient and collaborative decision making. Dashboard Editor completed customer beta testing last year and has been available as a self-service capability in Fuel Dashboard since fall 2020.
No two airlines are the same and rarely will airlines approach a problem exactly the same way.
When calculating and reporting on fuel savings, airlines conducting initiatives that do not rely exclusively on actual data calculations (like taxi out fuel, climb fuel or cruise altitude) will often have different views on how to determine their savings. Recognizing that there is no one-size-fits-all formula for this, Fuel Dashboard’s custom analytics module – Dashboard Editor – enables airlines to create their own savings calculation methodology and build tailored dashboards that display actual achieved savings in a way that makes sense for their operations.
As an example, let’s look at a custom dashboard the Fuel Dashboard team built to calculate departure weight savings. Using the QAR and flight plan data, the team looked at Planned Take-Off Weight and Actual Take-Off Weight to derive a variance. From that, we created a baseline and used it to calculate the savings variance.
The Take-Off Weight Variance falling above the baseline indicates that savings have been achieved – parameters like flight duration, weight factor, and total number of flights can then be used to derive actual savings.
Dashboard Editor equips airlines with the ability to create a custom analysis like this using the 650+ parameters available within the Fuel Dashboard solution. Users can apply diverse data triggers, filters, and a range of visualization techniques to customize reports and dashboards for more accurate, efficient and collaborative decision making. Dashboard Editor completed customer beta testing last year and has been available as a self-service capability in Fuel Dashboard since fall 2020.