Your Aircraft Are Not Flying at Maximum Fuel Efficiency, and Your FMC Cannot Tell You That
The Gap Between Assumption and Reality
Most airlines operating with Cost Index 0 believe they are maximizing fuel efficiency. They are not.
The logic is understandable. Cost Index balances time-related operating costs against fuel cost. When fuel dominates that equation, the index trends toward zero, and at zero, the Flight Management Computer is supposed to command Maximum Range Cruise, the speed at which the aircraft achieves the greatest distance per unit of fuel burned.
The problem is that the FMC is working from data that does not reflect the aircraft you actually operate.
Every performance model stored inside a flight management system was built during certification testing, on a new aircraft, under controlled conditions, using baselines that have no way of accounting for years of engine wear, maintenance cycles, aerodynamic changes, or the operational realities of revenue service. The aircraft your crews fly today is not the aircraft that generated those numbers.
That gap, between the certified model and the actual machine, is where fuel savings disappear. While I’m going to dive into some technical detail here, the action you’ll see at the end is straightforward.
What Cost Index Actually Controls
Cost Index is a ratio between time-related operating costs and fuel cost. It determines ECON speed: the cruise speed at which total trip cost is minimized, not fuel burn.
This distinction is frequently misunderstood. ECON speed accounts for crew costs, maintenance rates, and leasing expenses alongside fuel. It is an economic target, not an aerodynamic one. Maximum Range Cruise, the speed that delivers the lowest fuel consumption per nautical mile, is only reached when the Cost Index approaches zero.
The formula differs between manufacturers. Boeing expresses Cost Index as the hourly time cost divided by the cost of 100 pounds of fuel. Airbus uses the per-minute time cost divided by the cost of one kilogram of fuel. A Cost Index of 30 on a Boeing aircraft cannot be compared to a Cost Index of 30 on an Airbus aircraft as they use different units. Fleet-wide CI policies that ignore this distinction introduce inefficiency by design.
When fuel prices rise and time-related costs become relatively less significant, airlines correctly push their Cost Index toward zero. The intent is sound. But the execution depends entirely on whether the FMC’s performance model accurately reflects the aircraft’s current aerodynamic and engine state, and in most cases, it does not.
Why the FMC Cannot Find True MRC on Its Own
Certification flight testing is conducted under conditions that bear little resemblance to airline operations. Speeds are stabilized manually, with autothrottle disengaged, over extended periods, on a factory-fresh aircraft. The resulting data is normalized to standard atmospheric conditions and stored as the reference performance model.
In service, the same aircraft flies with Autothrottle or Autothrust continuously adjusting thrust to hold target speed. Engine efficiency degrades with cycles. Surfaces accumulate drag from repairs, paint, and operational wear. Temperature deviations from the ISA standard affect performance in ways the FMC does not fully account for.
Each aircraft in a fleet gradually develops its own performance signature, a unique combination of aerodynamic and propulsion characteristics that diverges from the original certification model. That divergence is invisible to the FMC. The system continues to associate Cost Index 0 with a fuel mileage curve that may no longer correspond to the aircraft’s actual behavior.
The aircraft thinks it is flying at MRC. In many cases, it is not. The problem is that the FMC is working from data that does not reflect the actual aircraft you’re operating. Fortunately, there is an easy way to fix this.
Rather than relying on certified baselines, Cost Index Optimization processes real operational data collected through recorded flight data. This is not modeled performance, it is observed performance, drawn from the actual flight history of each individual aircraft in the fleet.
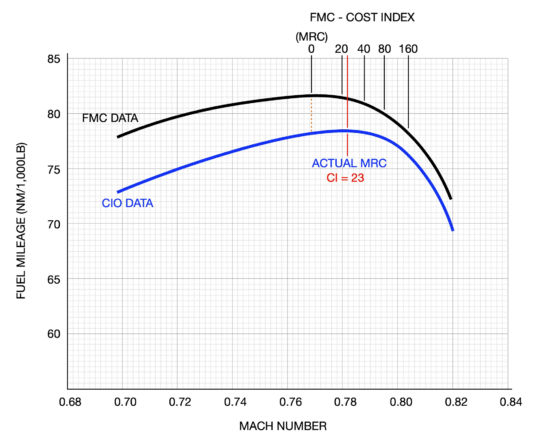
From this data, Cost Index Optimization constructs a tail-specific fuel mileage profile that reflects how each aircraft actually performs in service. It then identifies where true Maximum Range Cruise lies for that aircraft, and calculates the Cost Index value that, when entered into the FMC, commands the speed corresponding to actual maximum fuel efficiency.
Fuel Mileage data analysis comparing FMC and CIO, on a Boeing 737-800 weighing 150,000lb at FL350.
The distinction from conventional CI management is significant: Cost Index Optimization does not recalculate Cost Index based on time-related costs. It locates true MRC for the real aircraft and provides crews with the precise CI input needed to reach it, correcting for the performance drift that static FMC models cannot account for.
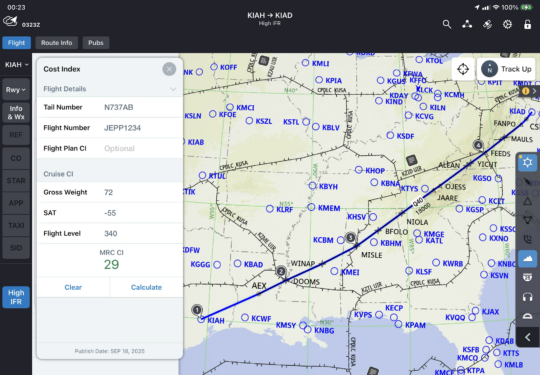
The advisory is delivered through Jeppesen Flight Deck Pro, integrating directly into existing crew workflows without requiring changes to FMC software or certification databases.
The Operational and Financial Case
Fuel typically represents 30 to 40 percent of an airline’s total operating costs. Marginal improvements in cruise fuel efficiency, applied consistently across a fleet and across thousands of flight hours, compound into material savings.
The airlines that capture those savings are not necessarily flying different routes or operating newer aircraft. They are operating the same fleet with more accurate information about how that fleet actually performs.
Cost Index Optimization provides that information. It transforms operational data that airlines are already collecting into a fuel efficiency strategy calibrated to each individual aircraft, closing the gap between certified assumptions and real-world performance, and turning a systematically overlooked source of fuel waste into a measurable, repeatable reduction.
The question is not whether the gap exists. For most fleets, it does. The question is whether your operation is equipped to close it.
Cost Index Optimization integrated with Jeppesen Flight Deck Pro.